
Sale Reports
Apartments for Sale Price October 2024 Property Transparency Report by propertysorted.com
By Property Sorted2 min read
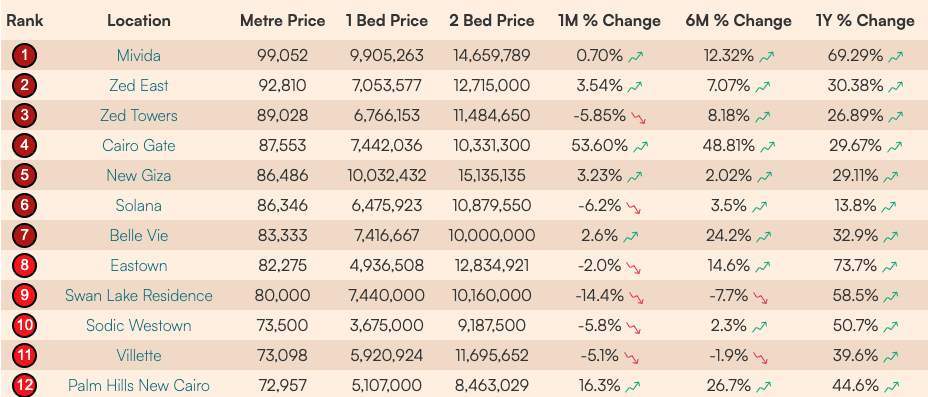
| Rank | Location | Metre Price | 1 Bed Price | 2 Bed Price | 1M % Change | 6M % Change | 1Y % Change | |
|
1
|
Mivida | 99,052 | 9,905,263 | 14,659,789 | 0.70% | 12.32% | 69.29% | |
|
2
|
Zed East | 92,810 | 7,053,577 | 12,715,000 | 3.54% | 7.07% | 30.38% | |
|
3
|
Zed Towers | 89,028 | 6,766,153 | 11,484,650 | -5.85% | 8.18% | 26.89% | |
|
4
|
Cairo Gate | 87,553 | 7,442,036 | 10,331,300 | 53.60% | 48.81% | 29.67% | |
|
5
|
New Giza | 86,486 | 10,032,432 | 15,135,135 | 3.23% | 2.02% | 29.11% | |
|
6
|
Solana | 86,346 | 6,475,923 | 10,879,550 | -6.2% | 3.5% | 13.8% | |
|
7
|
Belle Vie | 83,333 | 7,416,667 | 10,000,000 | 2.6% | 24.2% | 32.9% | |
|
8
|
Eastown | 82,275 | 4,936,508 | 12,834,921 | -2.0% | 14.6% | 73.7% | |
|
9
|
Swan Lake Residence | 80,000 | 7,440,000 | 10,160,000 | -14.4% | -7.7% | 58.5% | |
|
10
|
Sodic Westown | 73,500 | 3,675,000 | 9,187,500 | -5.8% | 2.3% | 50.7% | |
|
11
|
Villette | 73,098 | 5,920,924 | 11,695,652 | -5.1% | -1.9% | 39.6% | |
|
12
|
Palm Hills New Cairo | 72,957 | 5,107,000 | 8,463,029 | 16.3% | 26.7% | 44.6% | |
|
13
|
Hyde Park | 69,253 | 5,193,995 | 10,041,724 | 2.5% | 17.3% | 49.9% | |
|
14
|
De Joya Residence | 66,667 | 4,933,333 | 7,200,000 | -5.3% | -3.4% | 49.0% | |
|
15
|
Palm Parks | 66,061 | 5,945,455 | 10,107,273 | -10.1% | -10.6% | 43.1% | |
|
16
|
Il Bosco New Capital | 60,176 | 4,874,265 | 7,762,718 | -5.4% | -5.1% | 53.6% | |
|
17
|
Badya | 58,385 | 3,503,072 | 7,648,374 | -13.7% | -15.5% | 58.9% | |
|
18
|
Creek Town | 58,164 | 5,118,400 | 7,444,945 | -8.8% | -5.9% | 28.0% | |
|
19
|
Village West | 54,878 | 4,115,854 | 6,750,000 | -3.2% | -4.4% | 13.3% | |
|
20
|
Il Bosco City | 53,990 | 4,103,216 | 6,964,670 | -11.8% | -13.6% | 70.3% | |
|
21
|
Madinaty | 53,448 | 3,420,690 | 5,131,034 | 4.8% | 43.4% | 101.3% | |
|
22
|
Taj City | 51,535 | 4,122,812 | 5,926,542 | -2.1% | 38.8% | 76.7% | |
|
23
|
De Joya 1 | 51,146 | 3,784,792 | 5,523,750 | 12.2% | -17.8% | 12.7% | |
|
24
|
Al Burouj | 50,313 | 3,521,908 | 6,792,251 | 4.5% | 36.5% | 41.8% | |
|
25
|
Hap Town | 48,810 | 4,539,286 | 8,200,000 | 24.0% | 16.1% | 88.5% | |
|
26
|
Sun Capital | 48,161 | 3,708,361 | 5,779,264 | 0.8% | 3.3% | 32.1% | |
|
27
|
Al Rehab | 48,022 | 2,881,295 | 4,321,942 | -4.7% | 8.7% | 39.0% | |
|
28
|
Beverly Hills | 47,368 | 2,368,421 | 5,684,211 | 1.6% | 8.1% | 35.2% | |
|
29
|
Mountain View Icity | 46,875 | 4,218,750 | 5,859,375 | 16.0% | 19.0% | 77.0% | |
|
30
|
Stone Residence | 44,000 | 2,596,000 | 6,160,000 | 7.3% | 34.6% | 67.4% | |
|
31
|
Suli | 43,767 | 3,063,686 | 5,602,169 | 0.0% | 4.2% | 70.6% | |
|
32
|
Sarai | 43,182 | 3,411,364 | 4,836,364 | 1.4% | 16.3% | 38.0% | |
|
33
|
Dream Land | 40,099 | 2,686,634 | 5,212,871 | 4.0% | 33.7% | 75.5% | |
|
34
|
City Of Odyssia | 33,345 | 3,001,014 | 4,935,000 | -4.1% | 132.7% | 35.0% | |
|
35
|
Al Narges | 30,422 | 2,433,768 | 6,084,419 | 4.9% | 17.0% | 58.5% | |
| Total Average | 62,669 | 4,901,593 | 8,291,566 | 1.6% | 14.4% | 48.3% | ||
| Have a question? |
More articles
All articles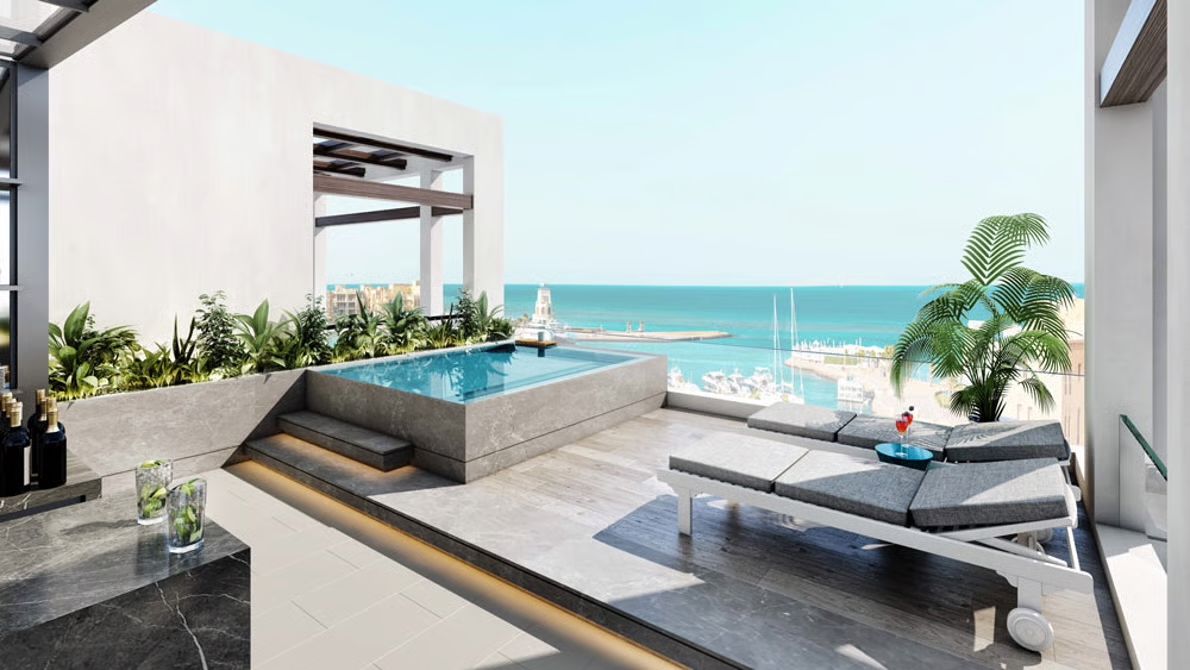
4 min read
The Top 10 Most Expensive Apartments in Egypt: From 62 Million to 286 Million EGP
We have all seen the prices rising, but have you ever wondered what the absolute most expensive apartments in Egypt actually look like? We…
Read article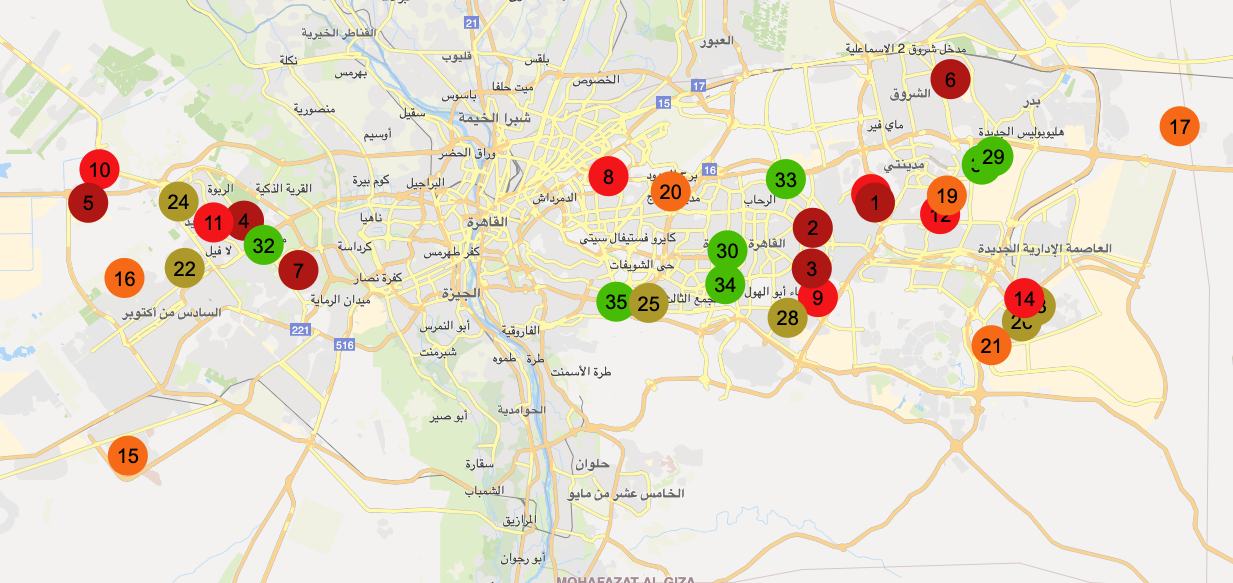
Sale Reports3 min read
Apartments for Sale Price - Property Transparency Report by propertysorted.com - May 2025
PropertySorted.com May 2025 report provides a monthly analysis of asking sale prices for real estate across Egypt. We rank 35 locations…
Read article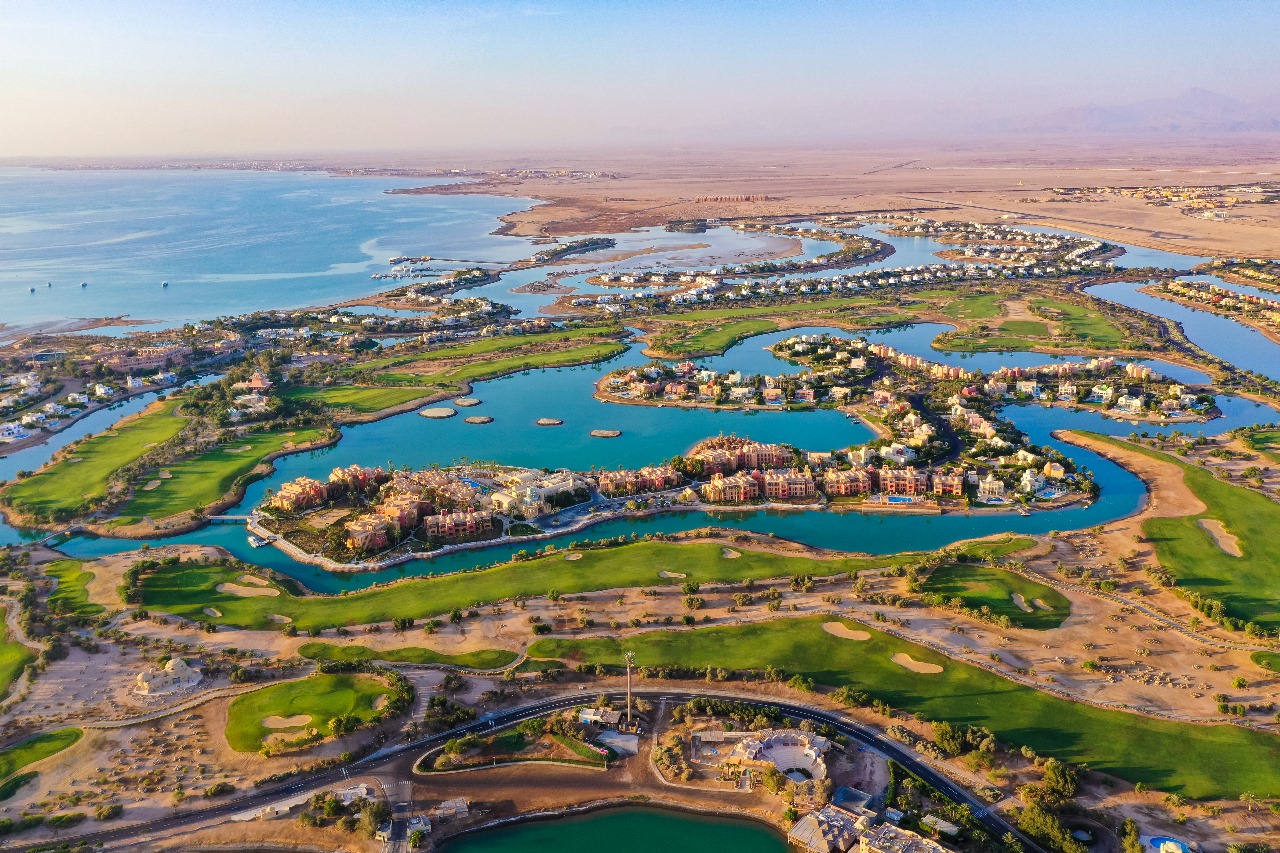
El Gouna14 min read
Thinking of Moving to El Gouna? 39 Must-Know Questions
El Gouna, often dubbed Egypt’s “Venice by the Red Sea,” is a luxury, self-contained resort town with year-round sunshine developed by…
Read articleStill unsure?
Ask about your own case.
Tell us the area, your budget and what you need. You get real listings and straight answers.